We can expect 25,000 people to be injured or killed by fires in the United States this year. With over 130 million housing units across the country, 4.5 million of them do not have smoke detectors, placing their inhabitants at substantial risk. Driving this number down is the single most important factor for saving lives put at risk by fire.
A broad range of people are trying to address this issue, from local fire departments to the Red Cross. However, they all face the same problem: Which door do we knock on first?
Prioritizing outreach for fire prevention is difficult without access to data and analytics targeting at-risk houses. By drawing together different public data sets, we developed a predictive model that identifies hot spots of homes that are unlikely to have smoke alarms.
In collaboration with the Red Cross, DataKind, and local fire departments, we are working to help get smoke alarms where they need to be. The goal is to provide a tool that helps fire departments and other groups work more efficiently. Local fire department outreach coordinators can combine their on-the-ground knowledge about their areas with trained models scored at a newly enhanced geographic granularity. This is only a first step. We are also releasing all of the data, components and algorithms that make this tool work in hopes that others can improve upon what we have begun.

In November of 2014 there was a house fire in the Broadmoor neighborhood of New Orleans that killed five people, including three children. The house did not have a smoke alarm. Enigma began working with New Orleans' Fire Department and Office of Performance and Accountability to develop a model that identified New Orleans blocks least likely to have smoke alarms, and most likely to experience a fire fatality. This enabled the New Orleans Fire Department to conduct a door-to-door outreach campaign that places smoke alarms in as many at-risk homes as possible. Drawing on our learnings from New Orleans, we extended the model to apply to cities within the 30 largest 'Metropolitan Statistical Areas', in hopes that more people can use and improve on our insights.
This tool is an example of applied data analytics aimed at improving the lives of people in cities. Below is an overview of the components and data involved in making it work.
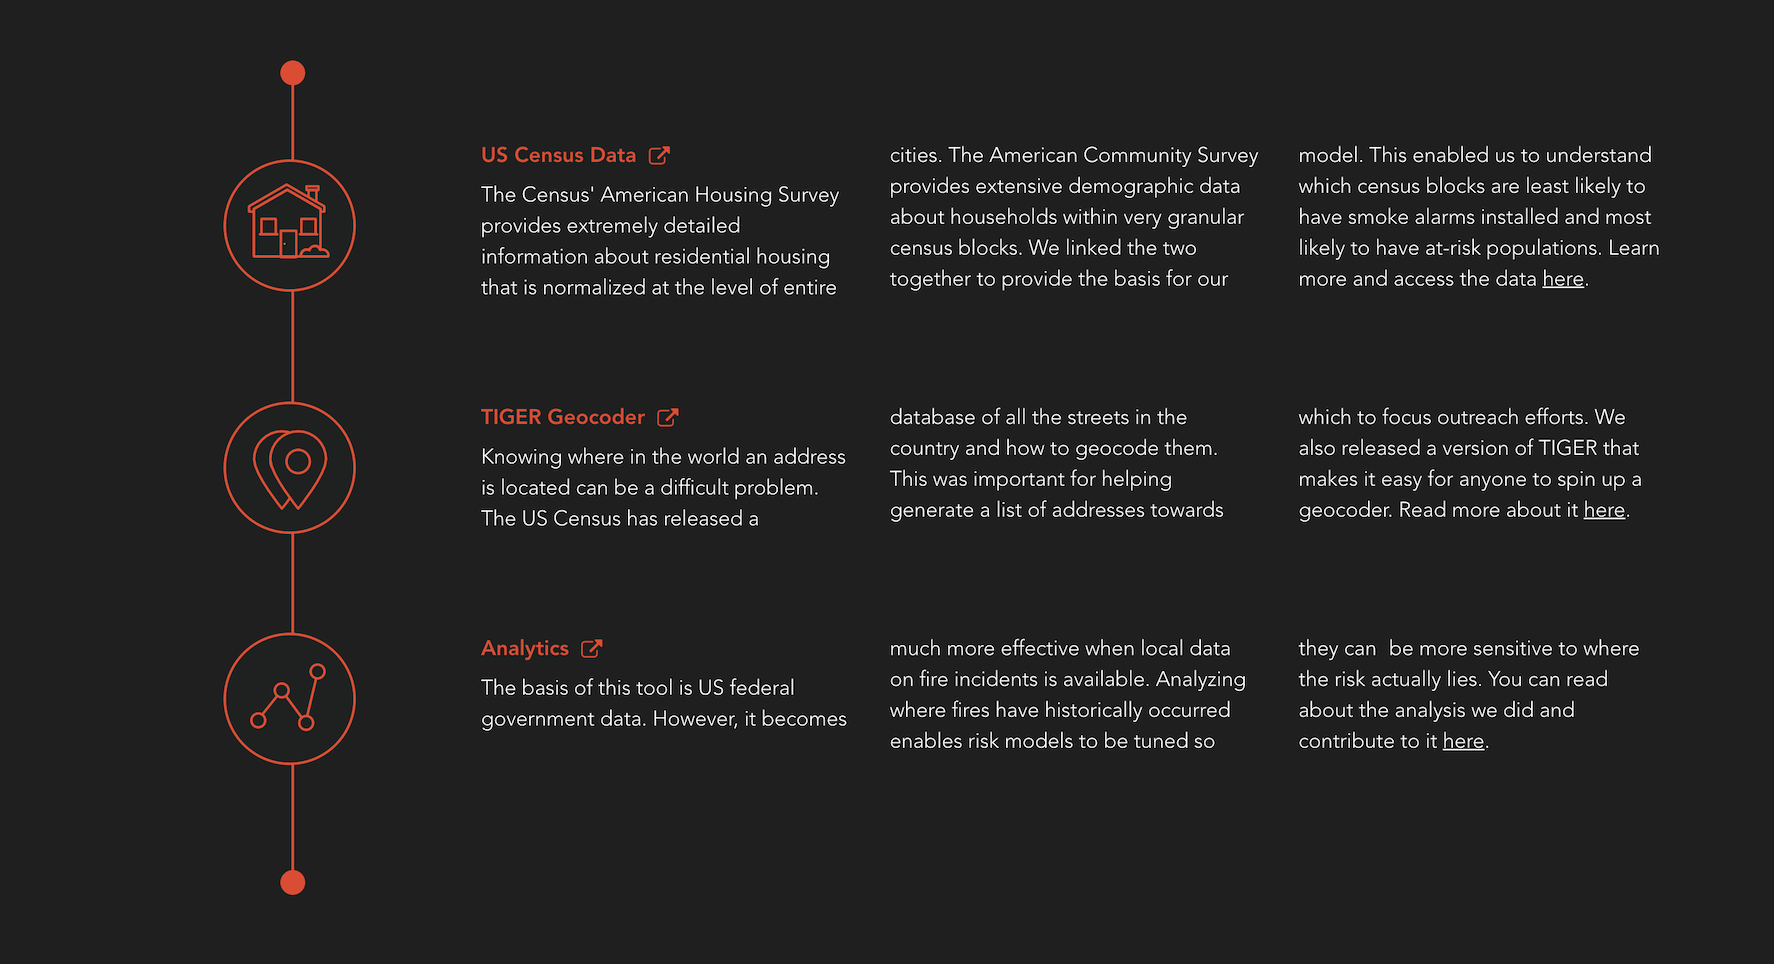
The Census' American Housing Survey provides extremely detailed information about residential housing that is normalized at the level of entire cities. The American Community Survey provides extensive demographic data about households within very granular census blocks. We linked the two together to provide the basis for our model. This enabled us to understand which census blocks are least likely to have smoke alarms installed and most likely to have at-risk populations. Learn more and access the data here.
Knowing where in the world an address is located can be a difficult problem. The US Census has released a database of all the streets in the country and how to geocode them. This was important for helping generate a list of addresses towards which to focus outreach efforts. We also released a version of TIGER that makes it easy for anyone to spin up a geocoder. Read more about it here.
The basis of this tool is US federal government data. However, it becomes much more effective when local data on fire incidents is available. Analyzing where fires have historically occurred enables risk models to be tuned so they can be more sensitive to where the risk actually lies.


